If you are system developer and would like to understand how certain running applications are loading your system CPU from time to time, then this tiny open source utility may able to assist you. Named as CPU Utilization Monitor and Logger, it will able to keep track of the CPU utilization percentage of a running system and log them down for further data analysis or graph plotting.
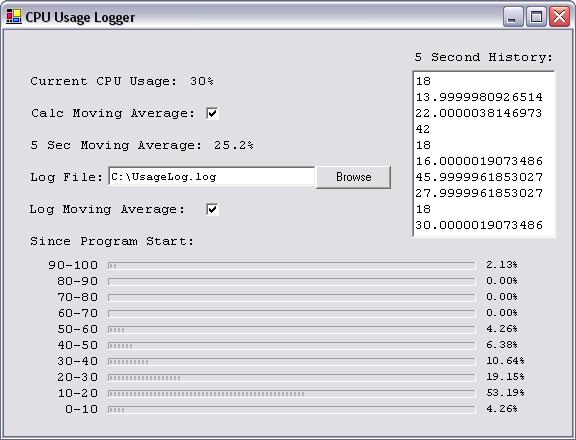
Once download and without the need to install it, just execute the utility and users will be brought to a simple interface. Over here, it will display the current CPU usage as similar to what you can observe in task manager. Besides, it also shows 5 seconds moving average and by ticking on ‘Calc Moving Average’, the data logging will start with running data visible in ‘5 Second History’ window. That is not all, users can optionally select to log moving average depending on own preference. For some users that would like to understand its CPU utilization distribution, just take a look on the breakdown as it also shows the percentage of utilization failing in certain brackets but what is more important here are those data will be logged in background once users define the log file’s name and location. Good thing is, the data can then be exported into excel worksheet or plotted as graphical chart suitable for presentation and sharing purpose.
Consumed less than 100kB, CPU Utilization Monitor and Logger is free for download especially suitable for data collection and analysis on CPU loading trend in Windows system.
 Tip and Trick
- How To Download HBO Shows On iPhone, iPad Through Apple TV App
- Windows 10 Insider Preview Build 19025 (20H1) for PC Official Available for Insiders in Fast Ring – Here’s What’s News, Fixes, and Enhancement Changelog
- Kaspersky Total Security 2020 Free Download With License Serial Key
- Steganos Privacy Suite 19 Free Download With Genuine License Key
- Zemana AntiMalware Premium Free Download For Limited Time