In a business presentation where there are a lot of data and figure to share with others can be really boring if the slides are loaded with text and numbers only. The audience probably could fall asleep and they won’t learn or remember what have been presented. When you have data and figure to present, it is always a good idea to present it in charts and graphs so that the audience can perceive your message faster than a table or a list. Human beings are more receptive of visuals rather than texts. To insert cool graphs and charts to your presentation, you could make use of spreadsheet programs such as Microsoft Excel to create charts or graphs. Besides spreadsheet apps, users could also make use of some web-based data visualization tools to create some cool charts or graphs. One of the useful and powerful data visualization tools that can help users to do the job is VizLytics.
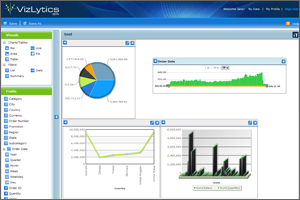
 The new VizLytics data visualization solution by LogiXML is a simple and easy-to-use web based tool that allows users at all skills levels to upload data and generate graphics (charts, graphs, etc) for better presentation. Users can explain the figure and data better in graphics with the aid of VizLytics. Besides, the tool also allows users to manipulate parameters so that users can explore their data and figure with customers from more angles.
VizLytics is currently in beta and it is free for signed up users. This data visualization tool is compatible with Microsoft Excel, Comma Separated Value (CSV), and GoogleDoc spreadsheet files. To create charts or graphs, registered users can upload their data in VizLytics supporting formats to VizLytics. After uploading the data, users can start creating their graphs. They can choose the graphs’ styles, drag and drop different visual styles, adjusting built-in data parameters, etc.
Recent Posts
- Able2Extract Professional 11 Review – A Powerful PDF Tool
- How to Install Windows 10 & Windows 8.1 with Local Account (Bypass Microsoft Account Sign In)
- How to Upgrade CentOS/Red Hat/Fedora Linux Kernel (cPanel WHM)
- How to Install Popcorn Time Movies & TV Shows Streaming App on iOS (iPhone & iPad) With No Jailbreak
- Stream & Watch Free Torrent Movies & TV Series on iOS with Movie Box (No Jailbreak)
 Tip and Trick
- How To Download HBO Shows On iPhone, iPad Through Apple TV App
- Windows 10 Insider Preview Build 19025 (20H1) for PC Official Available for Insiders in Fast Ring – Here’s What’s News, Fixes, and Enhancement Changelog
- Kaspersky Total Security 2020 Free Download With License Serial Key
- Steganos Privacy Suite 19 Free Download With Genuine License Key
- Zemana AntiMalware Premium Free Download For Limited Time